How to link Mailchimp to Google Looker Studio

By pulling Mailchimp data into Google Looker Studio, you can create dashboards which show how well your email marketing campaigns are performing and how this impacts your website and your business. But how do you do it? Let’s find out…
Mailchimp already offers strong analytics within its own platform. It allows you to see subscriber growth over time, demographic information, detailed information on your click and open rates, and even detailed e-commerce data.
By combining these powerful data points with the visualisation power of Google Looker Studio (formerly known as Google Data Studio) and its ability to merge multiple data sources, you can prepare your own custom reports and see exactly how Mailchimp is impacting your business.
Google Looker Studio is a powerful tool which enables you to pull in data from various sources and display them in any format you want – be it in tables or various types of graph – and really drill down into your data.
Out of the box, Google Looker Studio only provides a small number of connectors which let you to pull in data from a CSV file or from other Google properties. Thankfully, the wider community have built countless custom ‘connectors’, which allow you to pull data from various other sources directly into your Looker Studio dashboard.
Importing Mailchimp data into Google Looker Studio (formerly Google Data Studio)
Step 1 – Choose a 3rd party connector
Adding Mailchimp as a data source in Google Looker Studio requires a 3rd party connector.
Supermetrics and Power My Analytics are two of the biggest companies making Google Looker Studio connectors, and between them enable you to pull in data from 100+ data sources.
We have a review comparing the two here. While both have their own advantages and disadvantages, Supermetrics is by far the easiest if you want to get instant access to your Instagram data within Google Looker Studio. It connects directly to the Mailchimp API and can be set up in a matter of minutes.
Power My Analytics is a Data Warehouse solution, and will need to import your data into its warehouse before you can then pull it into Looker Studio. Data Warehouse solutions are typically useful if you’re importing huge amounts of historical data, but as Instagram’s API already provides instant historical information, it’s slightly overkill here.
Supermetrics has a 14 day free trial, so you can see if it’s the right solution for your business. After that it’s just $39 USD a month for the Individual plan, which includes 1 data source, 1 user and 5 accounts per data source.
The Essentials plan is $69 per month for 9 data sources and 5 accounts per data source, which should be more than enough for most users. You can also add 1 additional data source for $35 per month.
For companies analysing mammoth amounts of data, or agencies managing lots of client accounts, there is also a Super plan for $579 a month, allowing up to 72 data sources and 10 accounts per data source.
Step 2 – Sign up for the 14 day free trial of Supermetrics
There isn’t a free Mailchimp to Google Looker Studio connector, so you’ll need to use a third party one.
Supermetrics offers a free trial of their connectors, which gives you ample time to get everything set up and check that the solution is right for you. Simply visit the Supermetrics website and sign up to start your trial.
Step 2 – Make a Looker Studio report, or choose a template
Sign into your Google Looker Studio account and create a blank report.
We’re currently putting together our own MailChimp report, which will be available soon. This will save you time in pulling together your own – all you’ll need to do is replicate our template, connect your MailChimp account as a data source and you’re all set.
Bookmark this page and come back in a week or two to download the connector. For now, you can make your own by starting with a blank report.
Supermetrics also offer their own pre-made template. Visit their Looker Studio Template Gallery, search for ‘MailChimp‘, then select ‘Mailchimp email marketing report template for Looker Studio‘.

The template shows emails sent and click rate over time, as well as a ‘Campaign details’ section showing a detailed overview of each of your campaigns, showing opens, clicks, unique clicks, bounces, and your open and click rates compared to the industry average.
Step 3 – Connect Looker Studio to your MailChimp account
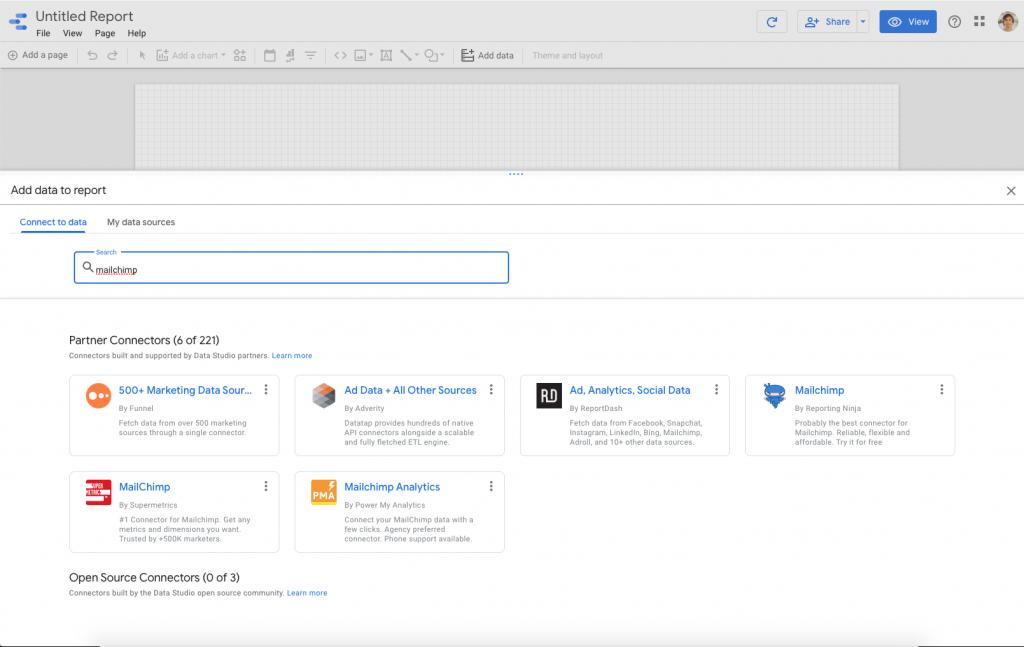
On the ‘Add data to report’ screen, ensure you’re on the ‘Connect to data’ tab
Type ‘Mailchimp’ into the search box, and from the ‘Partner Connectors’ list choose the ‘MailChimp by Supermetrics’ option, with the red icon.
Click the blue ‘AUTHORISE’ button underneath ‘Looker Studio requires authorisation to use this community connector’. This will give you a popup asking you to grant Supermetrics permission to use your Google account.
Click the second blue ‘AUTHORISE’ button underneath ‘MailChimp requires authorization to connect to data’. This time, you’re granting Supermetrics permission to access your Mailchimp account.

It will prompt you to log into Mailchimp with the account you want to pull in data for.

You’ll now hit a slightly more complicated screen. From the Select campaigns/lists dropdown, select the relevant Audience or individual Campaign that you want to analyse.If you check the “Allow ‘Select campaigns/lists’ to be modified in reports” button, you can then change this directly within your report, so it’s a good idea to check it if you want to use your dashboard to analyse your whole Mailchimp account.From Reporting timezone, select your local timezone so that your campaign data all shows up with the correct dates.
Under Query type, you’ve got various options depending on the type of report you want to put together – Automations, Automation emails, Lists, Campaigns, List activity, List growth history, List locations or List members. Choose appropriately depending on the kind of report you’re looking to make.

Click Next and you should be done.
Your Mailchimp account should now be a data feed within your new Google Looker Studio report, and you’re free to pull in all the dimensions and metrics needed to visualise your data.
For 20% off Supermetrics, use code rusticated upon signup.
We have more guides on using Supermetrics to pull data into Google Looker Studio here.